Reported flaring versus permitted volumes
The Canadian Press reported average multiples of 45 for warm/wet flares and 40 for cold/dry flares; storage/loading was 5×. These compare gas volumes, not measured human exposure.
Source, period & context ↓ sound moms
A place to learn, look closer and ask informed questions about the health of Howe Sound.
Reporting from Kitimat, questions for Howe Sound, and the records behind the headlines. Start with the numbers, then explore each source and what it can—and cannot—tell us.
These operational statistics describe LNG Canada in Kitimat, not Woodfibre LNG. They help frame questions about safeguards and monitoring; they do not predict pollution levels or health outcomes in Britannia Beach or Squamish.
The Canadian Press reported average multiples of 45 for warm/wet flares and 40 for cold/dry flares; storage/loading was 5×. These compare gas volumes, not measured human exposure.
Source, period & context ↓The Tyee reported this downtime across eight months for one production unit’s acid gas incinerator. One outage lasted two consecutive months.
Read the evidence & response ↓The Tyee’s analysis found Riverlodge’s annual average hourly non-methane hydrocarbon readings exceeded all 37 Alberta comparison stations. This was not a benzene-specific measurement or proof of its source.
Understand the comparison ↓12 resources
The Canadian Press · Lauren Krugel · April 9, 2026
Reporting on four months of filings gives average permit-volume multiples of 45× (warm/wet), 40× (cold/dry) and 5× (storage/loading). LNG Canada said increased flaring was part of early operations and would decline in regular operation.
These are category-specific averages for October 2025–January 2026, not a single facility-wide multiplier or a health-risk calculation. The supplied CBC page could not be retrieved; the figures were checked against the Canadian Press report carried by CityNews.
A question to take forward
What limits apply during startup, equipment failures and regular operation—and what happens after an exceedance?
The Narwhal · Matt Simmons & Lauren Watson · January 21, 2026
Documents described at least 170,000 m³/day needed to manage a flare integrity issue, versus a typical 11,000 m³/day. The regulator reported an average of about 205,000 m³/day for July–November 2025.
These figures have different reference periods and purposes. The regulator said added gas mitigated the integrity issue; the company described early-operation flaring as normal. Neither statement measures residents’ exposure.
A question to take forward
How quickly must equipment problems, interim controls and repair timelines be disclosed?
The Tyee · Zoë Yunker · July 20, 2026
One unit’s incinerator was reportedly offline for 139 days between September 2025 and April 2026. Pre-operation modelling anticipated outages around once a year for four to six hours.
During outages, acid gas was sent to a flare with added fuel. The company and regulator defended destruction performance; an interviewed chemical engineer disputed equivalence with controlled incineration. Downtime alone does not quantify ambient exposure.
A question to take forward
What operating restrictions and independent checks apply when pollution-control equipment is unavailable?
The Tyee · Zoë Yunker · July 21, 2026
An investigation described symptoms reported by residents and gaps in pollutant-specific monitoring. Its Riverlodge comparison covered non-methane hydrocarbons and 37 Alberta stations.
The article did not establish a causal link between residents’ illnesses and LNG Canada. Hydrocarbons are a broad category, not benzene alone. The company and regulator said increased flaring had not measurably affected local air quality. This July snapshot should not be read as a complete account of later monitoring changes.
A question to take forward
Which compounds are measured individually, at what detection limits, locations and sampling intervals?
Vancouver Sun · supplied reading
Full text not verifiedA reference for the policy debate and calls for stronger oversight. Read the publisher’s article for the specific proposals and responses.
The full article was not retrievable during this update. No numerical claims have been extracted from it. A political position is distinct from a scientific finding.
A question to take forward
Which proposed protections are binding, independently checked and enforceable?
CBC News · supplied local reference
Full text not verifiedA local reading on Woodfibre LNG and health concerns, alongside the separate Kitimat reporting.
The supplied CBC page was not retrievable during this update, so no statistics or detailed findings are attributed to it here. Local exposure and health conclusions require local evidence.
A question to take forward
What baseline health and exposure information will be available before Woodfibre operates?
BC Energy Regulator · data & reports
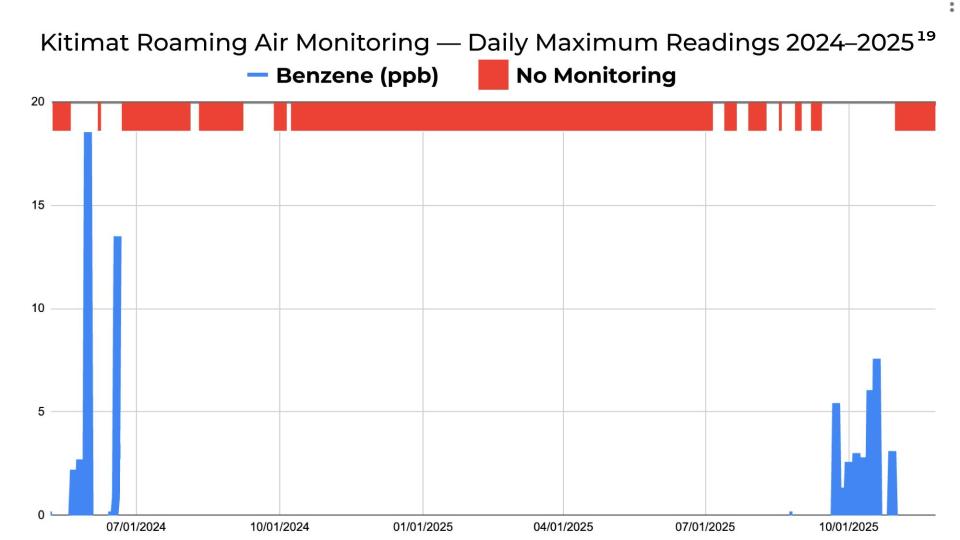
BCER links Roaming Air Monitor deployments for May–November 2024 and July–October 2025, with downloadable reports and data. Its page also links LNG Canada’s October 2025 modelling response, which concluded the additional flaring’s local air-quality effect was small to negligible.
A company-submitted modelling report is distinct from an independent health study. Mobile monitoring covers selected places and times. Raw observations need quality flags, units, detection limits, weather and appropriate averaging periods before interpretation.
A question to take forward
Can communities access validated compound-specific data and independent analysis, including short-duration events?
Kitimat Airshed Group · supplied October 16 Facebook post
Announcement checked · results pendingThe supplied October 16 screenshot states that Phase 1 began at the start of October, using passive and canister sampling near Riverlodge. Samples had been sent for analysis, with results to follow. The post describes three planned phases.
Checked against the user-supplied screenshot; the year is supplied by the user and is not visible in the screenshot. The post’s statement about no previous BTEX measurements needs clarification alongside earlier BCER mobile benzene data. It does not establish there was no prior benzene monitoring in Kitimat. The screenshot does not provide lab results, detection limits or a complete sampling protocol.
A question to take forward
How would canister sampling complement continuous monitoring, and who would select events, analyze samples and publish results?
Environmental Health Perspectives · 2020 · peer-reviewed study
Examines flaring exposure and birth outcomes in the Eagle Ford Shale region of Texas. Exposure was assessed using flare events within 5 km during pregnancy.
An observational study in an oil-and-gas production region. It cannot establish causation or quantify risk from Woodfibre LNG in Howe Sound.
A question to take forward
Which local exposure data and health expertise are needed to assess relevance to Howe Sound?
UCLA · July 2020 · university research summary
An accessible starting point for understanding the UCLA–USC study on flaring and preterm birth.
This describes the same study as the entry above; it is not a second independent piece of evidence.
A question to take forward
What does the original paper say about uncertainty and other exposures?
BC Energy Regulator · project reference
A starting point for the regulator’s project information and linked permits and records.
A regulatory reference, not an independent health assessment. Check the dates, scope and conditions of each linked document.
A question to take forward
Which permit conditions address air quality, noise, monitoring and public reporting?
Squamish Nation · Rights & Title
The Nation’s own information about its environmental assessment agreements for Woodfibre LNG and the FortisBC project.
Read the Nation’s position directly. This resource does not imply endorsement of Sound Moms or replace engagement with the Nation.
A question to take forward
How can community advocacy respect the Nation’s rights, regulatory role and decision-making?
No matching resources. Try another search or clear the filters.
The supplied graph plots daily maximum benzene readings from 2024–2025, with red bands marking periods labelled “No Monitoring.” It shows intermittent measurements and substantial gaps—not a continuous record of exposure. The early 2024 peaks also show why this graph cannot, by itself, attribute readings to LNG Canada’s later operations.
BCER 2024 data ZIP ↗ · BCER 2025 data ZIP ↗
Proposed local monitoring question: Who will fund independent, validated benzene sampling in Howe Sound, where will samples be collected, and how quickly will results and methods become public?
We prioritize original research and official documents, alongside reporting that adds context. Inclusion is not endorsement. Findings from other places are not local risk estimates. This is an initial collection, not a systematic review or medical advice.
Original publications remain with their publishers and repositories; we link to them rather than republish their full text. As the collection grows, monitoring methods, noise research and local technical assessments will need their own carefully reviewed entries.
Collection updated October 22, 2026. Sources may change; check the original for the latest information.